Category Archives: Oracle
All those yellow sticky notes about Oracle will usually end under this category.
ORASRP – Oracle Session Resource Profiler
Thanks to the paper Oracle Analysis 101, written by Glenn Fawcett (Sun) I have a new Oracle performance troubleshooting tool on my USB key. It’s called orasrp (Oracle Session Resource Profiler), written by Egor Starostin. Basically it’s an Oracle trace file analyzer/profiler with a nice html based report that supports statement graph among other things. It’s written in D language with binaries available for Windows, Linux and Mac OS X. Supports trace files from Oracle 7.2 – 11g.
You can download orasrp from: http://www.oracledba.ru/orasrp/
klafr called
This note is more as a reminder to myself than anything else…perhaps, it’s time to phase out 9i clients at our site for good, at least on workstations used by our developers. Today, I found a bunch of trace files with:
...
*** SERVICE NAME:(SYS$USERS) 2009-05-06 11:49:42.540
*** SESSION ID:(291.1143) 2009-05-06 11:49:42.540
klaflr called
...
Based on my past experience I knew that this kind of trace files containing klafrlr called are a direct consequence of running SQL*Loader 9.2.0.5 in direct path mode. No errors at the user side, thought. It’s just annoying to purge trace files. As a short-term solution I’ll ask part of our team that is still using 9i client to run SQL*Loader from our network based 10g client installation point, but the proper solution is to move on and replace all those old workstations with the ones that include 10g client.
SQL*Net tracing in 11g
As you know, Oracle in 11g consolidated directories used for all kind of diagnostic operations, for better or worse. Anyway, that includes SQL*Net tracing at client side. On Windows (if not explicitly specified or turned off), trace files will end up deep down under your Documents and Settings folder, for example:
C:\Documents and Settings\alesk\Oracle\oradiag_alesk\diag\clients\user_alesk\host_34047044_11\trace
Fortunately, we can turn this pest off and trace the client the same way as we did before 11g:
sqlnet.ora
DIAG_ADR_ENABLED = OFF
TRACE_LEVEL_CLIENT = 10
TRACE_FILE_CLIENT=11g_odac.trc
TRACE_DIRECTORY_CLIENT=T:\TRACE
...
...
A short memo about _fix_control
While reading Jonathan Lewis blog about Histogram change I noticed interesting comment by Randolf Geist in which he mentioned a “feature” introduced in 10.2.0.2 – an undocumented parameter _fix_control that can be used to turn off/on a particular bug fix. I was not aware of this parameter until now.
Usually this sort of the parameter could be handy when some bug fix introduces more headache to a DBA than merits. One such example for a “bug fix” is the one Randolf and Jonathan discussed, Bug 5483301: Cardinality of 1 when predicate value non-existent in frequency histogram.
We could turn off this fix with the command:
alter system set "_fix_control"='5483301:off' scope=both;

or for the session

alter session set "_fix_control"='5483301:off';
Be careful using this parameter (or any other underscore parameter!) on your production servers. A quick search on Google revealed some “testimonials” such as the one at Pythian (see “Undocumented parameter _fix_control Or How to break your database”), where someone with the name Abel (apparently working in Oracle support) shed some light on this feature. According to Abel every bug fix that could be turned off must be registered (check v$system_fix_control), unless Oracle developer that wrote the bug fix code doesn’t want to register the patch or simply forgets to do the registration. Abel listed bug fixes related to the wrong results as the ones that are not registered on purpose. Forgotten bug numbers that users found should be reported to Oracle, so that they can take care about registration. Sweet.
That’s why it’s highly recommended that you beforehand check if particular bug fix is registered or not:
SQL> select bugno, value, description, optimizer_feature_enable from v$system_fix_control where bugno=5483301;

     BUGNO      VALUE DESCRIPTION           OPTIMIZER_FEATURE_ENABLE
---------- ---------- --------------------- -------------------------
   5483301          1 Use min repeat count  10.2.0.4
                      in freq histogram to
                      compute the density
Personally, I would use _fix_control as my last resort, turning off individual fixes sounds to me a risky business due to the fact that such combination is very likely not regression tested. On the other hand, it can be handy when trying to prove some thesis on non-production servers, a real time saver compared with fresh server installation with lower patch set version.
Oracle ADDM report: “Significant Virtual Memory Paging Was Detected…”
During my experimentation with ADDM with Oracle10g on Windows 2003 x64 I found frequent warning at the top of the report, such as:
Significant virtual memory paging was detected on the host operating system.
RECOMMENDATION 1: Host Configuration, 100% benefit (8567 seconds)
ACTION: Host operating system was experiencing significant paging but no
particular root cause could be detected. Investigate processes that
do not belong to this instance running on the host that are consuming
significant amount of virtual memory. Also consider adding more
physical memory to the host.
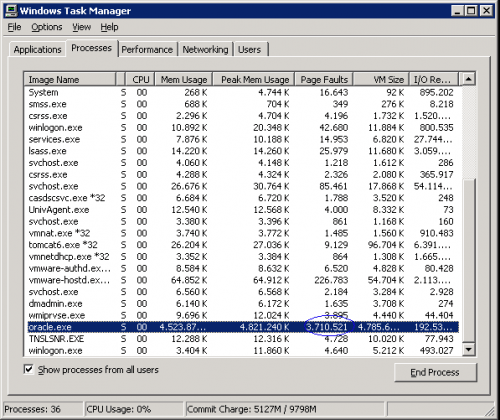
I knew that this message is likely a bogus one, considering that Windows OS handles virtual memory a bit different than other operating systems. If you launch Task Manager you can easily observe Page Faults rapidly increasing during warm up phase of the Oracle instance (for example after fresh startup):
The other day I found Oracle official explanation:
Note:395957.1 ADDM Reports “Significant Virtual Memory Paging Was Detected On The Host Operating System”
My recommendation is that ADDM advice on Windows platform should be cross checked with OS trying to find out if real memory paging is going on. If you found that for example Oracle process Peak Memory Usage is (was) close to the amount of physical memory, it’s very likely that ADDM warning is not a bogus one and that real memory paging is going on, that need to be addressed.

You must be logged in to post a comment.